In this post, we’ll be using a tool called fluentbit to send logs to a log aggregation platform, in this case Datadog. fluentbit allows us to process and enrich our logs before sending them to add additional context. This is extremely useful when trying to hunt down the cause of an issue.
fluentbit
fluentbit is a light weight tool written in C to collect, parse, filter, and send logs to multiple outputs including stdout, files, and external providers like Datadog. It is part of the Cloud Native Computing Foundation as a subproject of fluentd . fluentd can do everything fluentbit can, however it’s written in ruby (and C) which is not as easy to deploy as the single binary you get with fluentbit due to the possibility that the plugins will have dependency version conflicts. You can read the docs for a more in depth comparison.
Installation
We’ll be using Debian 10 (Buster) but the documentation has installation guides for other systems. The packaged versions of fluentbit go under the name td-agent-bit as the packages are maintained by Treasure Data , the original creators of fluentd. To get it installed, use the following commands:
$ wget -qO - https://packages.fluentbit.io/fluentbit.key | sudo apt-key add -
$ echo 'deb https://packages.fluentbit.io/debian/buster buster main' | sudo tee /etc/apt/sources.list.d/td-agent-bit.list
$ sudo apt-get update
$ sudo apt-get install td-agent-bit
We should now have the /opt/td-agent-bit and /etc/td-agent-bit directories as well as a systemd unit available. Use the following commands to check that everything is ready to go
$ /opt/td-agent-bit/bin/td-agent-bit --version
$ sudo systemctl status td-agent-bit.service
Now we’re ready to move onto configuring fluentbit!
Configuration
The default configuration file can be found at /etc/td-agent-bit/td-agent-bit.conf and contains configuration to output cpu stats to stdout:
[SERVICE]
    # Flush
    # =====
    # Set an interval of seconds before to flush records to a destination
    Flush        5

    # Daemon
    # ======
    # Instruct Fluent Bit to run in foreground or background mode.
    Daemon       Off

    # Log_Level
    # =========
    # Set the verbosity level of the service, values can be:
    #
    # - error
    # - warning
    # - info
    # - debug
    # - trace
    #
    # By default 'info' is set, that means it includes 'error' and 'warning'.
    Log_Level    info

    # Parsers_File
    # ============
    # Specify an optional 'Parsers' configuration file
    Parsers_File parsers.conf
    Plugins_File plugins.conf

    # HTTP Server
    # ===========
    # Enable/Disable the built-in HTTP Server for metrics
    HTTP_Server  Off
    HTTP_Listen  0.0.0.0
    HTTP_Port    2020

[INPUT]
    Name cpu
    Tag  cpu.local
    # Interval Sec
    # ====
    # Read interval (sec) Default: 1
    Interval_Sec 1

[OUTPUT]
    Name  stdout
    Match *
This configuration has 3 sections:
SERVICE- general configuration optionsINPUT- a cpu input which will collect cpu metrics every 1 secondOUTPUT- match all our logs and send them to std out
Start the fluentbit service and check the output.
$ sudo systemctl start td-agent-bit.service
$ journalctl -fu td-agent-bit.service
...
[0] cpu.local: [1592420609.822015943, {"cpu_p"=>2.500000, "user_p"=>2.250000, "system_p"=>0.250000, ... }]
[1] cpu.local: [1592420610.821908722, {"cpu_p"=>5.875000, "user_p"=>3.750000, "system_p"=>2.125000, ... }]
...
Everything looks good so we’re ready to start modifying the configuration to collect system logs and send them to Datadog. First we want to clear out the default input and add our systemd input. Once we’ve done that (and removed the comments) we will have something that looks like this:
[SERVICE]
    Flush        5
    Daemon       Off
    Log_Level    info
    Parsers_File parsers.conf
    Plugins_File plugins.conf
    HTTP_Server  Off

[INPUT]
    Name systemd
    Tag systemd.*

[OUTPUT]
    Name stdout
    Match *
Restart the td-agent-bit service again and check the logs. You should see the systemd unit logs start to appear after the 5 second flush interval. Now we are ready to change the output to send the logs to Datadog! All you need to do for that is get an API key and add the output to our configuration.
[OUTPUT]
    Name        datadog
    Match       *
    Host        http-intake.logs.datadoghq.eu
    apikey      DATADOG_API_KEY
Now all that’s left to do is restart the td-agent-bit service and we should start seeing logs appearing in Datadog!
Bonus: Remapping fields
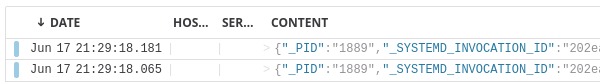
If we look at our logs in Datadog, we can see that the host and service fields are blank. However, the logs do contain this information.
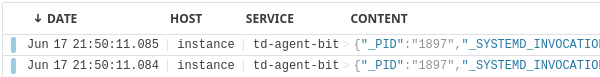
Instead of configuring Datadog to use these fields, we can remap them using fluentbit. Adding the following FILTER section will rename the _HOSTNAME field to host and the SYSLOG_IDENTIFIER field to service. Make sure to add this section between the INPUT and OUTPUT sections.
[FILTER]
    Name modify
    Match systemd.*
    Rename _HOSTNAME host
    Rename SYSLOG_IDENTIFIER service
Restart the service and check Datadog again. You should now see that the host and service fields are set correctly.